Chapter 4. Lung
Chapter Authors & Contributors
- Vicki Noble, MD
- Andrew S. Liteplo, MD, RDMS
- Jonathan Wallace, MD, RDMS
- Rayna Sharma, BScKin
- Adam Guthrie, BKin, MMgmt
4.1 Introduction
Lung ultrasound is a paradigm shift
"The voyage of discovery is not in seeking new landscapes but in having new eyes"
-Marcel Proust
Thoracic ultrasound is one of the more exciting applications for point-of-care ultrasound, as it has opened up the possibility for an improvement in the standard of care. For the last several decades, the mainstay for initial diagnostic imaging has been the chest radiograph. However, there are some inherent failings with the chest radiograph. First, changes in the chest radiograph image lag behind a patient's clinical picture - sometimes as long as 24 hours behind. Second, while the technology is portable, it requires a technologist, a machine that is usually not housed in the patient's room, image development that takes place in a remote area from the patient, and final image interpretation by a consultant - all of which add complexity and time to the diagnostic imaging process. Finally, given that each chest radiograph involves some small but non-zero exposure to ionizing radiation, there is some risk to the patient, which increases as chest radiography is used to monitor a patient's condition over time and a response to treatment. Thoracic ultrasound has none of these limitations. The biggest challenges for thoracic ultrasound are to get the physician to think in a radically different way about how to visualize pathology and to empower the clinician to feel that the thoracic ultrasound images are an equal, if not a more valid, indication of pathology and disease.
4.2 Basics/Terminology
- Pleural line is bright white line between rib shadows.
- A-lines represent normal lung
- B-lines represent interstitial fluid
- Low frequency (2.5-5.5 MHz) probe is preferred for most thoracic ultrasound
It is important to review a few anatomy points and terms before getting started with directed clinical questions for thoracic point-of-care ultrasound. First, anatomy and scan orientation. Rib shadows help to orient the sonographer by serving as a landmark for pleural line identification. As the ribs approach the sternum, they become cartilaginous, and so sound can penetrate through the rib at this point (#Movie 4.1). However, usually the ribs are calcified and so cast a shadow as the sound cannot penetrate through bone (#Movie 4.2).
Movie 4.1
Cartilaginous Ribs
Movie 4.2
Bony Ribs
Next, we can identify the pleural line. Because the visceral pleura and parietal pleura are usually closely opposed, it appears as a bright white line (#Movie 4.3). If there is an effusion, however, a dark stripe of fluid separates the visceral from the parietal pleura (#Movie 4.4). If you see this anteriorly, a large effusion or one that is located anteriorly is suspected.
It is important to remember that a normal lung has well-aerated alveoli and very thin interstitial tissue holding the alveoli together. It is also important to remember that air does not transfer sound well, but instead scatters it so that the sound does not return to the probe in an organized fashion (#Figure 4.1).
Movie 4.3
Normal Lung
Movie 4.4
Pleural Effusion
Figure 4.1
Ultrasound Scatter
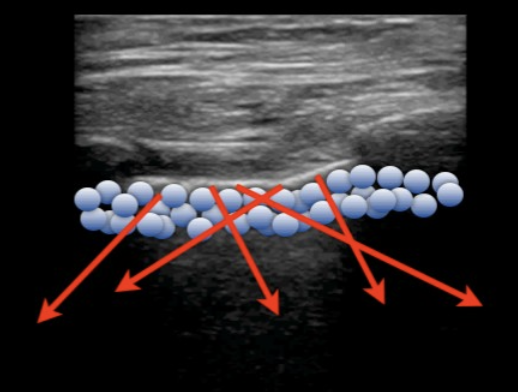
In a well-aerated lung, once the sound goes deep to the pleural line reflection, it is scattered and no organized information is returned to the probe to generate an image. Instead, the bouncing back and forth between the skin surface and the pleural line creates a horizontal reverberation artifact that is called an A-line (#Movie 4.5). If there is fluid or thickening of the interstitial tissue, however, the lung behaves more like a solid organ and sound is now able to reflect and refract such that a vertical, laser-like, bright, white line appears that originates from the pleura and is transmitted the full depth of the screen. These vertical lines are called B-lines and are a marker of interstitial thickening (from fluid or fibrosis) or alveolar fluid (#Movie 4.6).
There are a few features of B-lines that should be highlighted to ensure that what is seen is truly a marker of interstitial fluid. First, the B-line starts at the pleural line and travels at least to a depth of 18 cm (the minimum depth the screen should be set at when looking for this). In addition, B-lines will move back and forth with respiration as the pleural line moves. Finally, they initially appear as thin, single, vertical lines. As there is more interstitial fluid, the lines can start to coalesce and become more wedge-shaped.
There is a spectrum of B-lines ranging from none (when A-lines are usually seen), to mild, moderate, and severe, when there is often complete coalescence of single B-lines into white curtains of B-lines (#Gallery 4.1).
For most thoracic sonography, using the low frequency probe is preferred. The 2.5 - 5 MHz probe should be used when looking for interstitial disease and when looking for pleural effusions. When looking at the pleural line only, as when evaluating for pneumothorax, the linear probe with its higher resolution pictures can sometimes be helpful. It is also useful for orientation to start with the probe in a longitudinal position and orient with rib shadows at either edge of the screen (#Movie 4.7).
Movie 4.5
A-Lines
Movie 4.6
B-Lines
Movie 4.7
Normal Lung
Gallery 4.1
Spectrum of B-Lines
[[04_ChartB-LineSeverity.png]] | Progression of B-line density
[[04_PosLungCurve.png]] | Anterior position of curvilinear probe when looking for interstitial fluid.
[[04_PosPleuralEffusion.png]] | Mid-axillary position of curvilinear probe when looking for pleural fluid.
[[04_PosLungLinear.png]] | Anterior position of linear probe when looking at the pleural line.
4.3 Pneumothorax
- Lung sliding rules out pneumothorax with nearly 100% sensitivity in the area directly underneath the probe
- M-mode may be helpful in identifying pneumothorax as a barcode sign instead of the normal seashore sign.
- A lung point can be used to obtain an estimation of the size of a pneumothorax.
One of the simpler and more effective applications for thoracic ultrasound is the evaluation for pneumothorax The principle is simple. When the visceral and parietal pleura are opposed and respirations are observed, a slip-sliding or shimmering of the visceral on parietal pleura will be observed, essentially ruling out any air below the probe footprint with nearly 100% sensitivity[1][2] (#Movie 4.8). Another indication that the visceral and parietal pleura are touching is that a reverberation artifact between these two closely opposed structures will create a vertical, bright line similar to the B-line described above, but also known in this particular case as a comet-tail (#Movie 4.9).
Movie 4.8
Normal Lung Sliding
Movie 4.9
Comet Tail with Lung Sliding
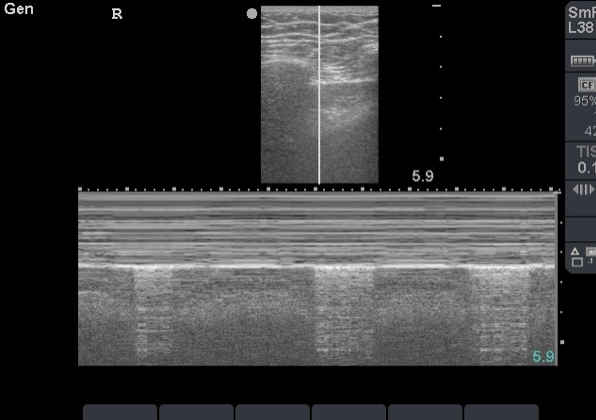
When viewed in M-mode, which portrays points along a line over time, the near field, which is superficial to the pleural line, is not moving and appears as straight lines. The far field, deep to the pleural line, is shimmering back and forth and appears grainy. This is known as the seashore sign (#Image 4.1).
Image 4.1
Seashore Sign
When air is interposed between the visceral and parietal pleura, the visceral pleura separates from the parietal pleura. All sound distal to the parietal pleura is scattered and does not return to the ultrasound probe in an organized fashion (#Figure 4.1). Therefore, the parietal pleura will be the last structure visualized by the ultrasound machine and will appear as a fixed, bright, white line (#Movie 4.10).
Movie 4.10
Pneumothorax
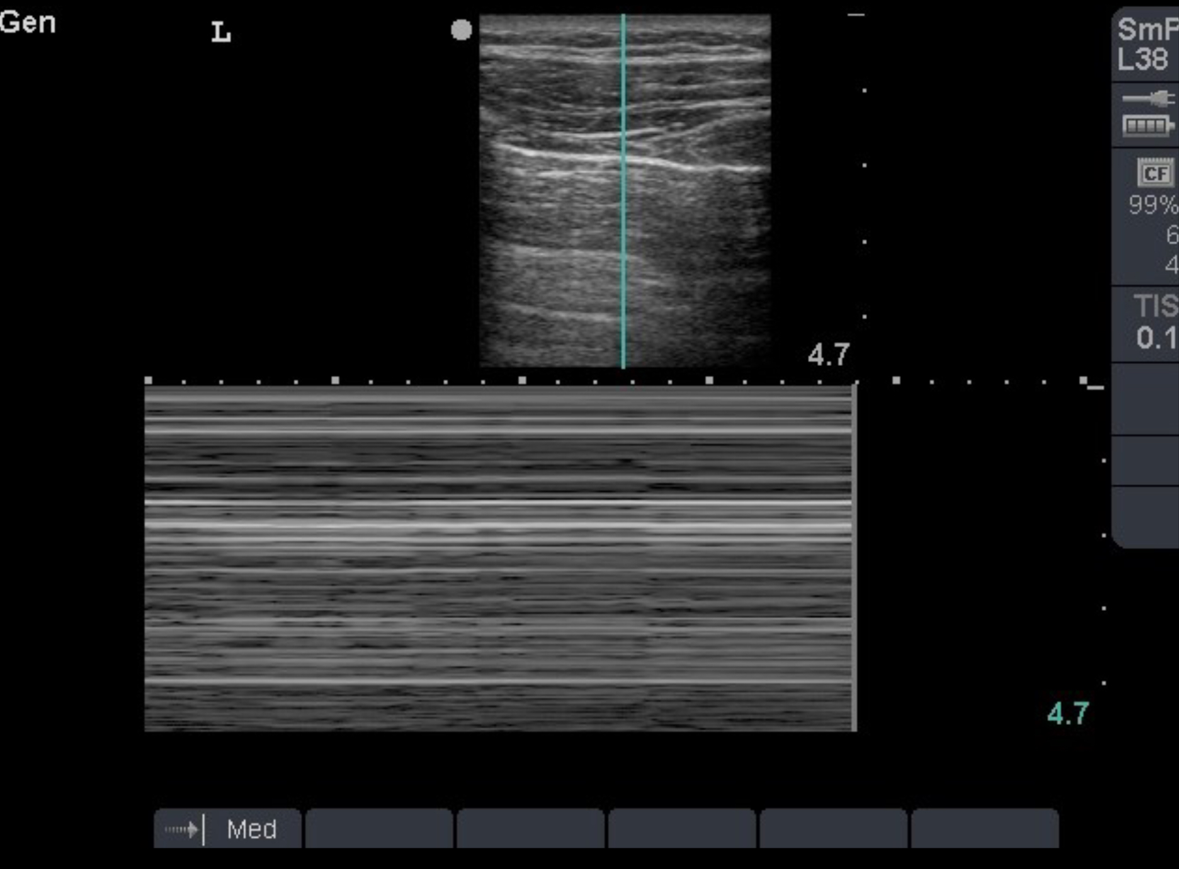
Deep to the pleural line, the high impedance of the air causes no real image to be generated. Instead, a reverberation artifact can cause mirroring, and sometimes a reflection of the chest wall can be seen. On M-mode, the chest wall still appears as straight lines, but since no lung sliding is seen, the area deep to the pleural line also appears as straight lines. This is known as the barcode sign (#Image 4.2).
Image 4.2
Barcode Sign
It is important to remember that lack of lung sliding can be seen in several conditions. Any condition that has fixed the pleura with scarring can cause lack of lung sliding. Examples include pleurodesis, surgical scarring, pneumonia with adhesions, and other pathologic diseases. Care must be taken to clinically differentiate these from pneumothorax to minimize false positive interpretations. Occasionally, when the pleura are still opposed but are fixed, comet-tail reverberations can still be seen with absent lung sliding and can help point to a false-positive for pneumothorax. When examining a supine patient, the probe should be placed over the anterior rib spaces, as air will tend to layer here.
It stands to reason that the more complete the evaluation of the thoracic cavity, the more sensitive the lung ultrasound will be for ruling out pneumothorax. However, studies have shown that the only pneumothoraces that would be missed if the anterior chest wall alone were scanned would be isolated apical pneumothoraces.[3] If there is a high degree of suspicion for a pneumothorax and the anterior chest wall shows lung sliding, scanning superiorly or even supraclavicularly to better evaluate the apices may be helpful. One last finding, which is essentially pathognomonic for pneumothorax, is the lung point sign. This is seen when you scan the position where the visceral pleura reattaches to the chest wall. When the probe is held in this location, one half of the ultrasound screen will demonstrate lung sliding and one half of the screen will show a fixed parietal pleura (#Movie 4.11). On M-mode, you will see alternating seashore and barcode signs, which vary with respirations (#Image 4.3). The lung point can be found by moving the probe around the chest wall, from areas of lung sliding to areas without lung sliding, until both are seen in the same location, as the patient breathes (#Movie 4.12). This point of reattachment can be followed around the chest wall to demonstrate an estimation of the size of the pneumothorax.
Movie 4.11
Lung Point
Image 4.3
M-Mode Lung Point
Movie 4.12
Pneumothorax Sizing
4.4 Pleural Effusion
- Ultrasound may be superior to chest radiography for detection of pleural effusion.
- The mirror image sign indicates that there is not a pleural effusion present. The spine sign indicates that there is a pleural effusion present.
- Pericardial effusions and pleural effusions can be differentiated based on position of fluid.
Another very simple and very effective application of thoracic sonography is the evaluation for pleural effusion. Again, research has shown not only is lung ultrasound comparable to chest radiography, it may be superior. In addition to its diagnostic value, thoracic ultrasound is able to assist in procedural guidance as well.[4][5][6]
This application takes advantage, again, of the ability of the well-aerated lung to scatter sound. When looking in the anterior or posterior axillary line in the longitudinal plane with a low frequency probe, the diaphragm should be identified. The diaphragm will be a bright, white structure that pulls inferiorly with inspiration in a spontaneously breathing patient (#Image 4.4).
Image 4.4
No Pleural Effusion
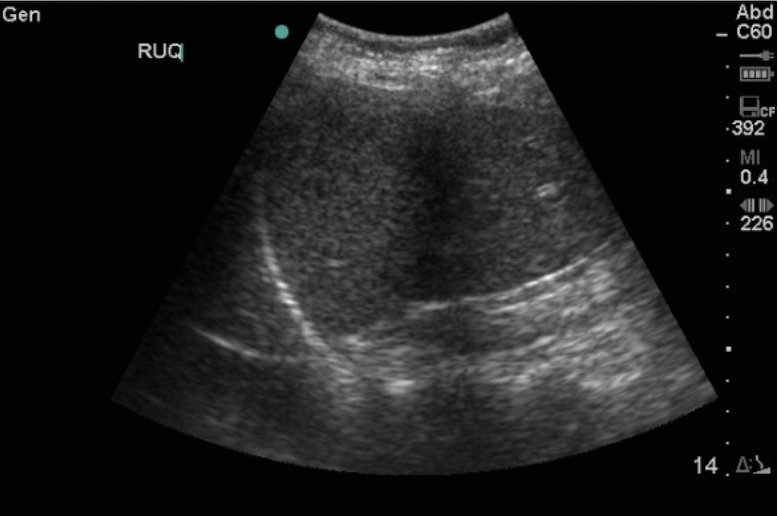
If there is air above the diaphragm, as in a normal lung, the sound wave will reflect off of the diaphragm and then be reflected back to the diaphragm after traveling through the liver or spleen tissue (#Movie 4.13).
Movie 4.13
Mirror Image Artifact
In this case, the ultrasound machine will assume the sound wave traveled in a straight line, and so liver tissue reflections will appear both above and below the diaphragm. This phenomenon is called the mirror image, and indicates that there is no pleural effusion and that the lung is well aerated. The lack of a mirror image artifact indicates that there is fluid above the lung, since sound can travel through the fluid and the effusion can be visualized directly (#Movie 4.14).
Movie 4.14
Pleural Effusion
Sometimes, however, the mirror image can be tricky to identify. In this case, we have another way to identify pleural fluid, which is known as the spine sign. This, again, makes use of sound’s ability to travel through fluid instead of being scattered by air. The spinous processes and vertebral bodies are deep to the kidney and spleen/liver when looking from the mid-axillary probe position. If the thoracic cavity is full of air, as the diaphragm expands and pulls caudally to aerate the lung, the shadow from the lung will cover the spine shadows above the diaphragm (#Movie 4.15). When the thoracic cavity is full of fluid, sound can travel through the thoracic cavity to the thoracic spine, and so the spine shadows are seen throughout respiration (#Movie 4.16).
Movie 4.15
Normal Aerated Thorax
Movie 4.16
Spine Sign - Effusion
Pleural effusions can also be visualized in other locations. Left-sided effusions can be seen in the far field of a parasternal long axis cardiac image and taper to the descending thoracic aorta where pericardial effusions would cross anterior to the aorta (#Movie 4.17). Right-sided effusions can be seen deep to the diaphragm in a subxiphoid cardiac view (#Movie 4.18). And as mentioned earlier, large effusions can sometimes be seen when scanning the anterior chest wall (#Movie 4.19).
Movie 4.17
Left Pleural Effusion
Movie 4.18
Right Pleural Effusion
Movie 4.19
Large Pleural Effusion
4.5 Interstitial Disease
- Pulmonary ultrasound has been shown to be superior to chest radiography in identifying interstitial disease in the right clinical scenario.
- Ultrasound can be used to identify pulmonary edema, pulmonary fibrosis, and infection.
The ability of thoracic ultrasound to distinguish between aerated lung and lung with interstitial fluid or disease has been well documented.[7][8][9] Clinical correlation is imperative as interstitial thickening can be a process of pulmonary edema, pulmonary fibrosis, infection or tumor/scarring. In the right clinical scenario, however, pulmonary ultrasound has been shown to be superior to chest radiography in identifying interstitial disease.[10]
The scanning technique uses the low frequency probe to scan in eight zones of the thoracic cavity to get a good sense of the distribution of disease (#Image 4.5).
Image 4.5
Scanning Zones
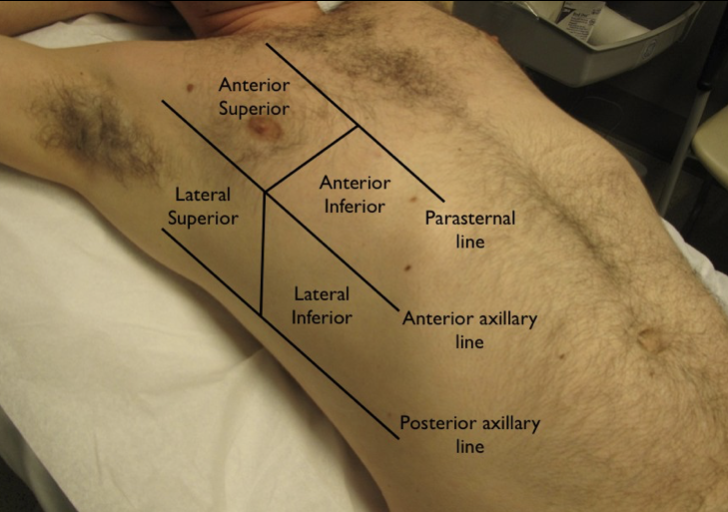
An isolated B-line - especially in the lateral and inferior lung zones - is considered normal or non-pathologic, but more than three B-lines per zone is considered pathologic, and that zone is considered positive for interstitial disease. The more B-lines that are present, the more pathologic the interstitial process, and this holds true across the disease spectrum including pulmonary edema, pulmonary fibrosis, and infection[8:1][9:1][11]([[#Movie 4.20]]).
Movie 4.20
B-Lines
There are a few clues that the clinician sonographer can use to help distinguish between the different etiologies of interstitial disease. In general, congestive heart failure and pulmonary edema are caused by fluid translocation, and so the pleural line in pulmonary edema will remain thin and regular (#Movie 4.21).
Movie 4.21
B-Lines
In contrast, diffuse infection or inflammation causing interstitial disease will tend to affect the pleura as well. In fibrosis, pneumonia, tuberculosis or other diffuse pulmonary infectious processes, the pleural line becomes irregular, lumpy and has areas of subpleural fluid collections[12][13] (#Movie 4.22).
Movie 4.22
Irregular Pleural Line
There is also some interesting evidence demonstrating prognostic value to the number and coalescence of B-lines on the initial evaluation for patients with dyspnea. Patients with high initial B-line scores had a worse prognosis and higher event scores at 16 months than patients with low B-line scores. B-line scores outperformed other echocardiographic variables as a univariate predictor.[14]
4.6 Consolidation/Pneumonia
- Lung sonography is a distinct improvement over chest radiography in the evaluation of pneumonia.
- Lung ultrasound can distinguish between lung consolidation and atelectasis.
In infection, as the interstitial space starts to consolidate and the alveoli and air-filled space in the lung become filled with fluid or purulent material, sound is transmitted through this tissue in the same way as through other soft tissue density organs in the body, such as the liver. The lung now behaves more as a solid organ and takes the appearance of a liver. This phenomenon is called hepatization, and it is easy to see why (#Movie 4.23).
Movie 4.23
Lung Hepatization
This finding has been well correlated with areas of consolidation on chest radiographs and with chest computed tomography. Indeed, multiple studies have shown that lung sonography is as sensitive and specific as computed tomography for pneumonia, and it is a distinct improvement over chest radiography.[15][16][17] In fact, the spectrum of infectious pulmonary disease reliably progresses from focal areas of interstitial disease (i.e. more than three B-lines per rib space in a focal pattern) to areas of coalescence of B-lines and irregular pleural lines to consolidation. This spectrum appears to follow the progression of disease seen on other gold standard diagnostic imaging, such as computed tomography.[10:1][15:1][16:1][17:1][18][19]
One interesting advantage of lung sonography is that it appears it can distinguish between lung consolidation and atelectasis, which is oftentimes a challenge for chest radiography. For consolidative processes, such as pneumonia or other infectious processes, the bronchi will be generally unobstructed, and because of the distinct difference in tissue density, the air moving in the bronchi with respiration will appear to be a bright, shimmery column, described as mobile air bronchograms (#Movie 4.24).
Movie 4.24
Consolidation
In contrast, atelectasis is a result of bronchial plugging, and so the air column within the consolidation is not mobile and is described as static (#Movie 4.25).
Movie 4.25
Atelectasis
4.7 Monitoring Pulmonary Function
- Fluid overload resolution can be observed in real time with ultrasound.
- Lung sonography can replace chest radiography in both emergency and critical care patients!
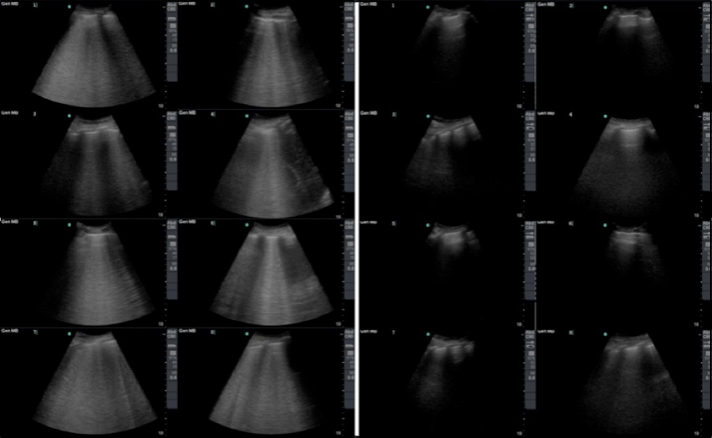
One of the strengths of pulmonary ultrasound over other forms of pulmonary diagnostic imaging is that the changes appear to resolve in real time.[20][21][21:1] As observed in patients undergoing dialysis, the B-lines of fluid overload appear to resolve in hours.[22] As observed in patients undergoing increases or decreases in the positive end-expiratory pressure settings on ventilators, the consolidation and B-lines appear or disappear rapidly[21:2] (#Image 4.6). This real-time monitoring function has the added advantage of being performed with a modality that requires no ionizing radiation, no patient transport and no lag time between image acquisition and interpretation for a trained clinician sonographer. This has led to a series of recent articles looking at whether or not lung sonography could, in fact, replace chest radiography for both emergency and critical care patients.[^10,][18:1][19:1] In our view, the answer is a resounding yes!
Image 4.6
B-Lines Over Time
4.8 References
Rowan KR, Kirkpatrick AW, Liu D, Forkheim KE, Mayo JR, Nicolaou S. Traumatic pneumothorax detection with thoracic ultrasound: correlation with chest radiography and CT--initial experience. Radiology. 2002;225:210-4. ↩︎
Blaivas M, Lyon M, Duggal S. A prospective comparison of supine chest radiography and bedside ultrasound for the diagnosis of traumatic pneumothorax. Acad Emerg Med. 2005;12:844-9. ↩︎
Ball GC, Kirkpatrick AW, Laupland KB et al. Factors related to the failure of radiographic recognition of occult posttraumatic pneumothoraces. Am J Surg. 2005; 189(5):541-546. ↩︎
Ma OJ, Mateer JR. Trauma ultrasound examination versus chest radiography in the detection of hemothorax. Ann Emerg Med. 1997;29:312,5; discussion 315-6. ↩︎
Eibenberger KL, Dock WI, Ammann ME, Dorffner R, Hormann MF, Grabenwoger F. Quantification of pleural effusions: sonography versus radiography. Radiology. 1994;191:681-4. ↩︎
Grimberg A, Shigueoka DC, Atallah AN, Ajzen S, Iared W. Diagnostic accuracy of sonography for pleural effusion: systematic review. Sao Paulo Med J. 2010;128:90-5. ↩︎
Volpicelli G, Mussa A, Garofalo G, et al. Bedside lung ultrasound in the assessment of alveolar-interstitial syndrome. Am J Emerg Med. 2006;24:689-96. ↩︎
Agricola E, Bove T, Oppizzi M, et al. "Ultrasound comet-tail images": a marker of pulmonary edema: a comparative study with wedge pressure and extravascular lung water. Chest. 2005;127:1690-5. ↩︎ ↩︎
Liteplo AS, Marill KA, Villen T, Miller RM, Murray AF, Croft PE, Capp R, Noble VE. Emergency thoracic ultrasound in the differentiation of shortness of breath: sonographic B-lines and N-terminal pro-brain type Natriuretic Peptide in Diagnosing Congestive Heart Failure. Acad Emerg Med. 2009;16:201-210. ↩︎ ↩︎
Zanobetti M, Poggioni C, Pini R. Can chest ultrasonography replace standard chest radiography for evaluation of acute dyspnea in the ED? Chest. 2011;139:1140-47. ↩︎ ↩︎
Gargani L, Doveri M, D’Errico L, Frassi F, Bazzichi ML, Delle Sedie A, Scali MC, Monti S, Mondillo S, Bombardieri S, Caramella D, Picano E. Ultrasound lung comets in systemic sclerosis: a chest sonography hallmark of pulmonary interstitial fibrosis. Rheumatology. 2009;48:1382-1387. ↩︎
Copetti R, Soldati G, Copetti P. Chest sonography: a useful tool to differentiate acute cardiogenic pulmonary edema from acute respiratory distress syndrome. Cardiovasc Ultrasound. 2008; 6:16. ↩︎
Sperandeo M, Varriale A, Sperandeo G, Filabozzi P, Piattelli ML, Carnevale, V, Decuzzi M, Vendemiale G. Transthoracic ultrasound in the evaluation of pulmonary fibrosis: our experience. Ultrasound Med Biol. 2009;35(5):723-9. ↩︎
Frassi F, Gargani L, Tesorio P, Raciti M, Mottola G, Picano E. Prognostic value of extravascular lung water assessed with ultrasound lung comets by chest sonography in patients with dyspnea and/or chest pain. J Cardiac Failure. 2007;13:830-835. ↩︎
Reissig A, Kroegel C. Sonographic diagnosis and follow-up of pneumonia: a prospective study. Respiration. 2007;74(5):537-47. ↩︎ ↩︎
Cortellaro F, Colombo S, Coen D, Duca P. Lung ultrasound is an accurate diagnostic tool for the diagnosis of pneumonia in the emergency department. Emerg Med J. 2012;29(1):19-23. ↩︎ ↩︎
Parlamento S, Copetti R, Di Bartolomeo S. Evaluation of lung ultrasound for the diagnosis of pneumonia in the ED. Am J Emerg Med. 2009;27:379-84. ↩︎ ↩︎
Copetti R. Cattarossi L. Ultrasound diagnosis of pneumonia in children. Radiol Med. 2008;113:190-98 ↩︎ ↩︎
Peris A, Tutino L, Zagli G, et al. The use of point-of-care bedside lung ultrasound significantly reduces the number of radiographs and computed tomography scans in critically ill patients. Anesth Analg. 2010;111:687-92. ↩︎ ↩︎
Liteplo AS, Murray AF, Kimberly HH, Noble VE. Real-time resolution of sonographic B-lines in a patient with pulmonary edema on continuous positive airway pressure. Am J Emerg Med. 2010;28:541.e5,541.e8 ↩︎
Bouhemad B, Brisson H, Le-Guen M, Arbelot C, Lu Q, Rouby JJ. Bedside ultrasound assessment of positive end-expiratory pressure-induced lung recruitment. Am J Respir Crit Care Med. 2011; 183(3):341-7. ↩︎ ↩︎ ↩︎
Noble VE, Murray AF, Capp R, Sylvia-Reardon MH, Steele DJ, Liteplo A. Ultrasound assessment for extravascular lung water in patients undergoing hemodialysis. Time course for resolution. Chest. 2009;135:1433-9. ↩︎