Chapter 8. Physics
! 700
Chapter Authors & Contributors
- Geoffrey E. Hayden, MD, RDMS
- Nova Panebianco, MD
- Jonathan Wallace, MD, RDMS
- Robert M. Mayall, BHSc, PhD
- Adam Guthrie, BKin, MMgmt
8.1 Basic Ultrasound Physics
"It is odd, but on the infrequent occasions when I have been called upon in a formal place to play the bongo drums, the introducer never seems to find it necessary to mention that I also do theoretical physics.”
- Richard Feynman
A basic understanding of ultrasound physics is essential to reliably acquire quality images and provide accurate interpretations. While many modern point-of-care ultrasound systems limit the operator’s ability to adjust the various settings, there remain a number of important features that allow users to customize and, indeed, improve imaging. This chapter will break down basic ultrasound physics into its essential components, with an emphasis on the core concepts of image acquisition as well as the host of imaging artifacts commonly encountered. The format for the chapter will be a series of bullet points supplemented by images and videos. A more in-depth look at the physics of ultrasound may be obtained through the core text, “Understanding Ultrasound Physics” by Sidney Edelman.[1]
Basic Ultrasound Physics
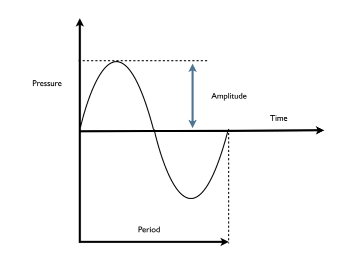
- Amplitude: The peak pressure of the wave (height); this is the magnitude or strength of the wave.
- Period: The length of time to complete 1 cycle.
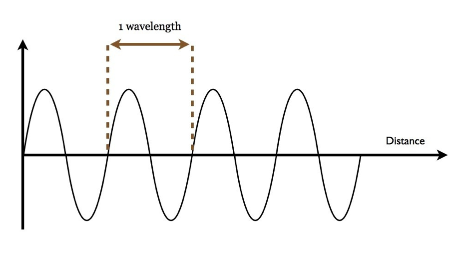
- Wavelength: The distance (length) of a complete cycle.
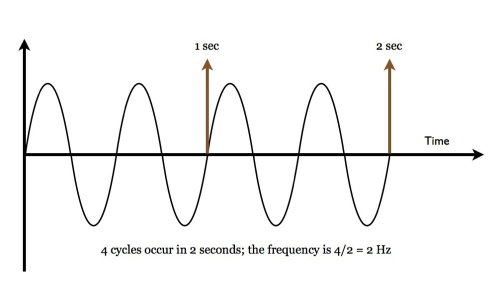
- Frequency: The number of cycles per second.
- Hertz (Hz) = 1 cycle/sec.
- Audible sound: 20-20,000 Hz.
- Ultrasound: >20,000 Hz.
- Diagnostic ultrasound: 2-20 megahertz (MHz) range.
- Determined by the sound source and not the medium that it is traveling through.
- Period and frequency are reciprocals.
- Velocity: Propagation speed of a wave through a medium.
- Velocity (V) = Frequency (f) x Wavelength (λ).
- Velocity is constant within a given medium.
- Determined by the characteristics of the medium (density decreases velocity and stiffness increases velocity).
- Frequency and wavelength are inversely proportional.
- If frequency increases, wavelength decreases.
- Power: The sound wave's strength.
- Power ∝ Amplitude^2
- Intensity: The sound beam's strength as determined by it's concentration of energy.
- Equals the power divided by the cross-sectional area (units: watts/cm^2).
- Intensity (I) = Power / beam area
#Table 8.1 summarizes ultrasound physics principles.
Table 8.1
Summary of Ultrasound Physics Principles
| Parameters | Basic Units | Units | Determined By |
|---|---|---|---|
| Period | time | sec, μsec | Sound source |
| Frequency | 1/time | 1/sec, Hz | Sound source, sonographer |
| Amplitude | Acoustic | dB (& others) | Sound source, sonographer |
| Power | Work/time | watts | Sound source, sonographer |
| Intensity | Power/area | watts/cm^2 | Sound source, sonographer |
| Wavelength | Distance | mm, cm | Sound source & medium |
| Speed | Distance/time | m/sec | Medium |
- Sound conduction is dependent on characteristics of the transmission media:
- As density increases, velocity decreases.
- As density decreases, velocity increases.
- Density is the concentration of mass per unit volume.
- As stiffness increases, velocity increases.
- Stiffness is a material’s ability to maintain its shape, even when pressure is applied (bone is stiff, lung tissue is not stiff).
- Because bone is very stiff but not dense, it has the fastest propagation speed.
- Generally, with regard to velocity: solids > liquids > gases.
- As continuous waves are not capable of producing an image, diagnostic ultrasound is derived from pulsed ultrasound.
- Shorts bursts, or pulses, of acoustic energy are produced.
- A pulse of ultrasound is a group of cycles:
- These all have a discrete beginning and ending.
- There is the “transmitting” time, or the “on” time.
- There is the “receiving” or “listening” time, or the “off” time.
- There are 5 parameters relevant to pulsed ultrasound (summarized at the end of this section in Table 8.2):
- Pulse duration
- Pulse repetition period
- Pulse repetition frequency
- Duty factor
- Spacial pulse length
- Pulse Duration (PD): length of time from the beginning to the end of a pulse.
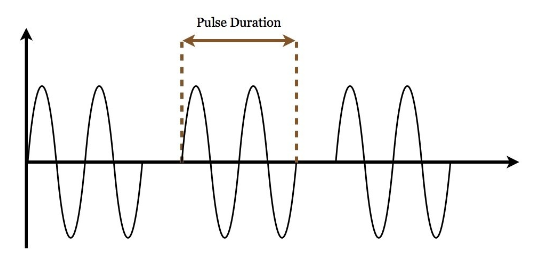
- Determined by the number of cycles (“ringing”), and the period (length of time) of each cycle.
- Fewer cycles = decreased ringing.
- Each cycle with a shorter period = increased frequency.
- Shorter pulses mean better images.
- PD = # cycles in pulse x period
- PD = # cycles in pulse / frequency
- Pulse Repetition Period (PRP): length of time from beginning of one pulse to the next (Figure 8.5).
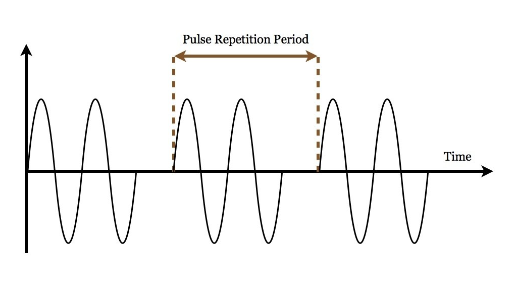
- Similar to period, but PRP includes the pulse duration and the “listening” time.
- Changed by adjusting the maximum imaging depth (depth of view).
- As depth increases the PRP increases (“listening” time increases).
- Pulse Repetition Frequency (PRF): number of pulses per second (Figure 8.6).”
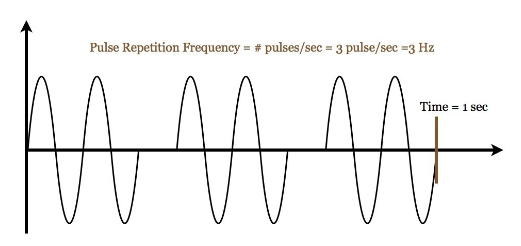
- Similar to frequency, though PRF refers to pulses/sec rather than cycles/sec.
- Changed by adjusting the maximum imaging depth (depth of view).
- Depth ⇑ then PRF ⇓ (listening time increases).
- PRP (sec) x PRF (Hz) = 1 (inversely related)
- Duty Factor: the percentage of time spent producing a pulse.
- Unit-less, ranges between 1.0 (100%) and 0.0 (0%).
- Changed by adjusting the maximum imaging depth (depth of view).
- Generally the duty factor is very low, with only a fraction of time spent transmitting a pulse, and much more time listening or receiving.
- Duty factor (%) = PD (sec) / PRP (sec) x 100
- PRF increases as Duty factor increases.
- Depth increases as Duty factor increases.
- PRP increases as Duty factor decreases.
- PD increases Duty factor increases.
- Spatial Pulse Length (SPL): length or distance of a pulse.
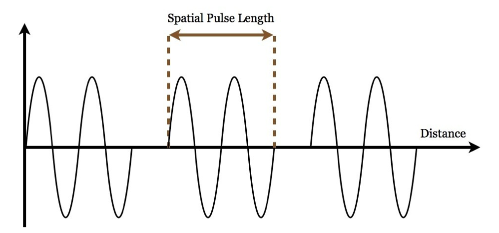
The following table summarizes pulsed ultrasound parameters (#Table 8.2).
Table 8.2
Summary of Pulsed Ultrasound Parameters
| Parameters | Basic Units | Units | Determined By | Common Values |
|---|---|---|---|---|
| Pulse duration | time | sec, μsec | Sound source | 0.5 - 3.0 μs |
| Pulse repetition period | time | sec, msec | Sound source, sonographer | 0.1 - 1.0 ms |
| Pulse repetition frequency | 1/time | 1/sec, Hz | Sound source, sonographer | 1 - 10 kHz |
| Spatial pulse length | Distance | mm, cm | Sound source, medium | 0.1 - 1.0 mm |
| Duty factor | None | none | Sound source, sonographer | 0.0001 - 0.01 |
8.2 Important Definitions
Key Terms:
- Attenuation
- Refraction
- Impedance
- Angle of insonation
- Resolution
Image Depth: calculated by the US machine by the time elapsed between signal pulse and the received echo.
Direction: the crystals precisely differentiate the direction of the returning echoes.
- The returning echo intensity is proportional to the grayscale assignment of the pixel (dot) of information on the screen; stronger signal, more echoes = brighter dot.
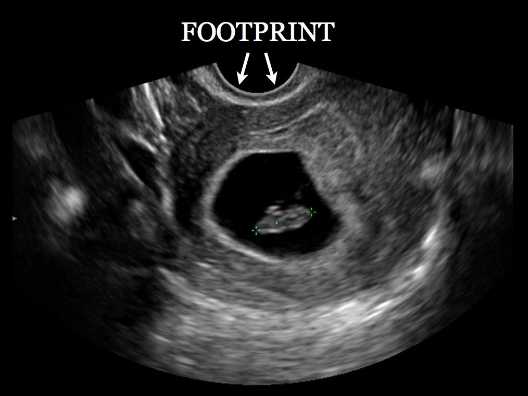
- The surface area of a transducer in contact with the patient is referred to as the “footprint” of the probe (#Image 8.1]).
Image 8.1
Footprint
Attenuation: The loss of ultrasounds energy (weakening) as it moves through a medium (the body,
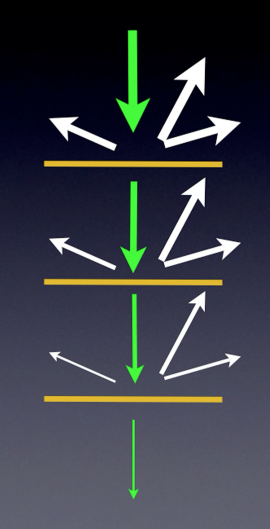
- Attenuation results in a decrease in intensity and amplitude.
- Determined by the frequency of the sound and the distance that the sound wave travels.
- As frequency increases, attenuation increases.
- As distance increases, attenuation increases.
- Attenuation of ultrasound waves occurs most commonly by:
- Absorption = energy converted to another form of energy (e.g. heat); this is the primary component of attenuation in soft tissue (≥ 80%).
- Reflection = redirection of sound back to the probe; very smooth reflectors (e.g. a mirror) are called specular.
- Scattering = if the boundary between media is irregular, the wave is reflected in a number of different directions; it is diffusely scattered.
- Occurs when the sound wave strikes material so small as to approach the wavelength of the cycles.
- Seen especially in lung tissue, hence the poor imaging.
- As frequency increases, scattering increases.
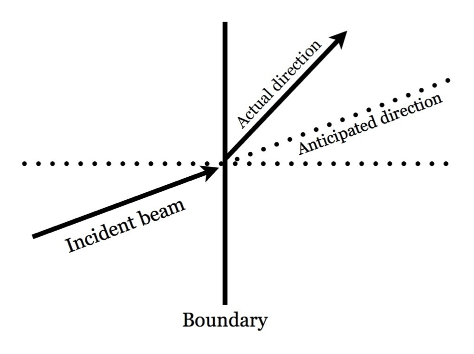
- Refraction = redirection of part of the sound wave when it crosses from one medium to another.
- Due to differing propagation speeds between the two media.
- Results in an effect similar to dipping a pencil in water, effectively “bends” the US wave.
Movie 8.1
Attenuation and Time Gain Compensation
Note the effects of attenuation (darker image) as depth increases. Time gain compensation is used to adjust for this.
Attenuation Coefficient: amount of attenuation per cm of tissue.
- As frequency increases, the attenuation coefficient increases.
- Does not change as sound travels in soft tissue.
Impedance: - The resistance to the propagation of sound.
- Characteristic of the specific medium.
- Impedance(rayls) = density(kg/m3) x propagation speed(m/s)
- Hence, impedance is related to density and propagation speed.
- Relative impedance: bone>>muscle>fat>blood>water>>>>>air.
Acoustic Impedance Mismatch: - Refers to the difference in acoustic impedance of two media at a boundary.
- The greater the mismatch, the greater the percentage of ultrasound reflected.
- In other words, the amount of reflection is proportional to the difference in the acoustic impedance between the two media.
- Intensity reflection coefficient (%) = (reflected intensity/incident intensity) x 100
Angle of Insonation (Angle of Incidence) (Figure 8.12, Movie 8.2).
- The angle between the incident ultrasound beam and an imaginary line that is perpendicular to the boundary of the object of interest; important for defining the boundaries of a vessel for a vascular study.
- Translated = need to scan perpendicular to object of interest to maximize returning echoes and improve image quality.
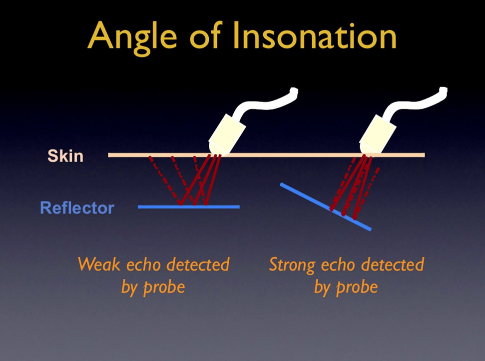
Movie 8.2
Effect of Incidence on Aorta
Note the clearer margins of the abdominal aorta as the angle of insonation is adjusted.
Resolution (#Gallery 8.1)
- The ability of the sound waves to discriminate between two different, closely spaced objects.
- Axial resolution = refers to the ability to distinguish between two closely spaced objects in a plane parallel to the ultrasound beam (resolve shallower and deeper object); also known as longitudinal resolution.
- The spatial pulse length is the major determinant of axial resolution; shorter pulses provide better images.
- The higher the frequency, the shorter the wavelength and spatial pulse length, resulting in better axial resolution.
- Lateral resolution = refers to the ability to distinguish between two closely spaced objects in the horizontal tissue plane (perpendicular to the ultrasound beam).
- The width of the ultrasound beam (array of crystals, distance between individual crystal rays or scan line density) is the major determinant of lateral resolution.
- More focal zones allows for enhanced resolution at particular depths of the scanning area, improving the lateral resolution; there is also some benefit to increasing the transducer frequency and decreasing the gain.
- Temporal resolution = ability to detect the position of moving objects at various points in time.
- Synonymous with frame rate.
- More frames/second leads to better temporal resolution; lower frame rate makes the video appear choppy or stuttering.
- Improved by narrowing the imaging sector, decreasing scanning depth, decreasing the line density, and decreasing the number of focal zones.
- Especially important in cardiac ultrasound
Gallery 8.1
Various Resolutions
[[Pasted image 20251219131311.png]] | Axial resolution
[[Pasted image 20251219131340.png]] | Lateral resolution
[[Pasted image 20251219131408.png]] | Frame rate circled in top left corner on cardiac ultrasound
8.3 Important Definitions
Scanning modes include:
- B-Mode
- M-Mode
- Colour Doppler
- Power Doppler
- Spectral Doppler
B-Mode Ultrasound
- Grayscale ultrasound (#Image 8.2).
- Most common scanning mode.
- “B” = Brightness.
- Strong echoes are represented by white dots.
- Absence of echoes are represented by black dots.
Image 8.2
B-Mode Ultrasound of the Aorta
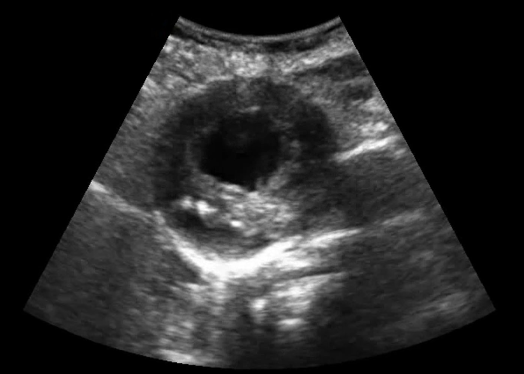
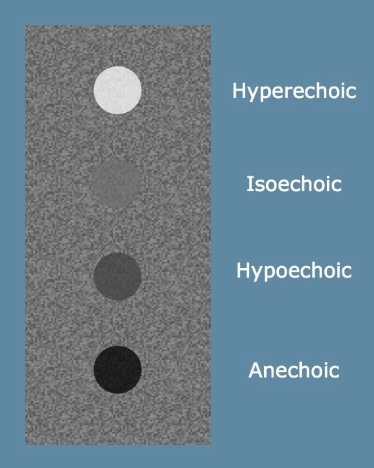
Terminology (#Figure 8.13):
- Echogenic = bright (white) objects
- Anechoic = dark (black) objects
- Hyperechoic = brighter (more white) than comparison structure
- Hypoechoic = darker (more black) than comparison structure
- Isoechoic = same echogenicity as comparison structure
Figure 8.13
Echogenicity Examples
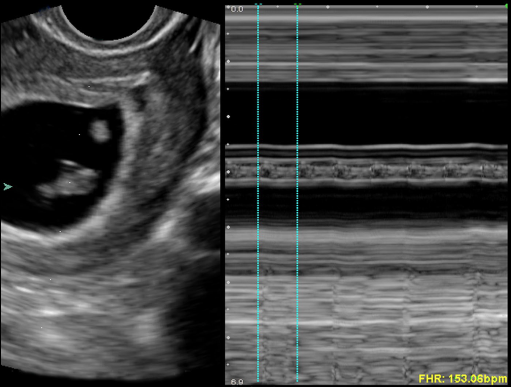
M-Mode Ultrasound (#Image 8.3)
- B-mode scanning appears on the left, while a tracing of tissue movement over time appears on the right (depth and time).
- Vertical axis is depth and corresponds to the B-mode image.
- Horizontal axis represents time.
- Particularly useful in fetal heart rate measurements and cardiac imaging.
Image 8.3
M-Mode Being Used to Determine a Fetal Heart Rate
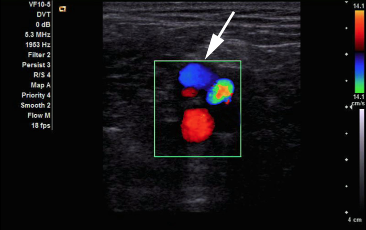
Color Doppler (#Image 8.4, #Movie 8.3)
- Measures mean velocity and direction of flow, superimposing colour over a B-mode image.
- A colour scale display on the side of the screen gives information on mean velocity.
- The colour superiorly represents flow toward the probe, and inferiorly represents flow away from the probe.
Image 8.4
Colour Flow Doppler of the Upper Thigh
Movie 8.3
Colour Doppler of a Carotid Artery
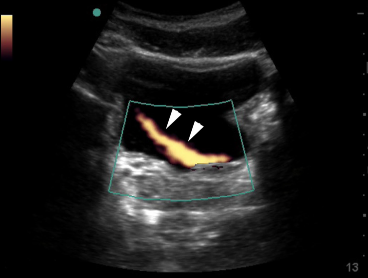
Power Doppler (#Image 8.5, #Movie 8.4)
- Averages flow over several frames.
- Has a greater sensitivity for evaluation of low flow states (e.g., testicular or ovarian flow).
- Gives no information on flow direction.
Image 8.5
Power Doppler Identifies a Ureteral Jet
Movie 8.4
Power Doppler Applied to the Bladder with a Ureteral Jet Noted
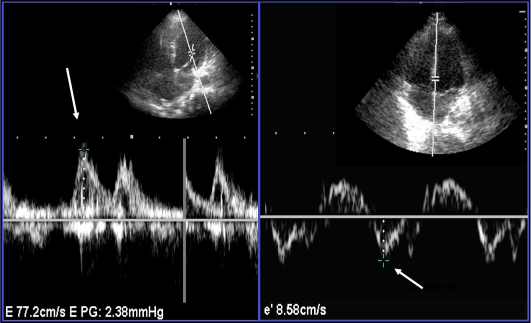
Spectral Doppler (#Image 8.6)
- Uses continuous or pulsed wave technology.
- Quantitative assessment of flow velocity at a single point within the “gate” (pulsed wave) or along the entire line of interrogation (continuous wave).
- Very helpful in cardiac imaging.
Image 8.6
Spectral Doppler in Cardiac Imaging
8.4 - Knobology
Most important knobs:
- Power
- Gain
- Depth
- Power: The total energy delivered by the transducer; increasing the power increases the intensity of the ultrasound beam. Typically, the power is fixed to limit potential adverse biologic effects.
- Gain: Degree of amplification of the returning signal. Adjustments to gain increase or decrease the overall brightness of returning echoes on the screen. Analogous to the volume knob on a stereo.
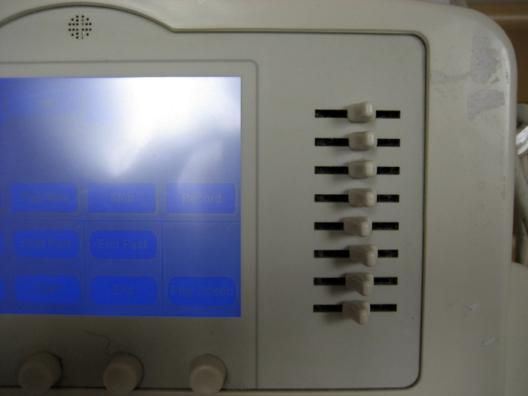
- Time Gain Compensation: Typically, a series of “sliders” arranged vertically, allowing preferential adjustments of gain at different levels of tissue. Also known as TGC (#Image 8.7).
Image 8.7
Time Gain Compensation Sliders
- Depth: Adjusts the field of view to increase or decrease the scanning area.
- Frequency: Adjusts the frequency of sound emitted by the probe. The higher the frequency, the better the resolution and the lower the penetration.
- Focus: Improves image resolution at a particular level (depth) of the ultrasound screen. Often appears to the right of the image as an arrow (or group of arrows/foci).
- Dynamic Range: The range of returning echo intensities that the machine processes in forming the grayscale image (measured in decibels, 30-78 dB). If you decrease the dynamic range, the weaker signals in the spectrum are lost, and there will be greater contrast between black and white (good for vascular studies). A higher dynamic range will give you more shades of gray, hence more detail regarding the tissue imaged.
- Tissue Harmonics: The transducer listens for sound waves returning at twice the frequency of the pulse that was emitted from the transducer (the second harmonic). This “harmonic frequency” is less susceptible to distortion as compared to the traditional frequency; mainly echoes from deeper structures. Artifacts due to side lobes and scatter are greatly reduced, and are subject to less attenuation.
8.5 - Probes
Probe Types:
- Curved array
- Phased array
- Endocavitary
- Linear
The Probes (#Gallery 8.2)
It is important to note that the range of frequencies for the various probes is quite variable, depending on the particular ultrasound manufacturer.
Gallery 8.2
Various Probes
[[Pasted image 20251219133120.png]] | Curvilinear probe and footprint
[[Pasted image 20251219133148.png]] | Phased array probe and footprint
[[Pasted image 20251219133215.png]] | Endocavity probe and footprint
[[Pasted image 20251219133239.png]] | Linear probe and footprint
Curved Array Probe:
- Low frequency (common frequency range of 2 to 5 MHz).
- Sector scanning format.
- Large footprint and scanning area, though decreased resolution with increasing depth.
- Ideal for all abdominal, retroperitoneal, and OB/GYN studies.
- Also known as curvilinear probe.
Phased Array Probe: - Low frequency (common frequency range 1 to 5 MHz).
- Sector scanning format.
- Smaller footprint than the curved array.
- Ideal for cardiac studies.
Endocavitary Probe: - Moderate frequency (common frequency range of 8 to 15 MHz).
- Small footprint, great resolution.
- Ideal for intraoral or transvaginal studies.
Linear Array Probe:
- Higher frequency (common frequency range 5 to 15 MHz).
- Arrays are parallel, maintaining resolution with increasing depth.
- Scanning area is limited to the size of the probe.
- Probe of choice for vascular access, soft tissue and musculoskeletal, and venous compression studies.
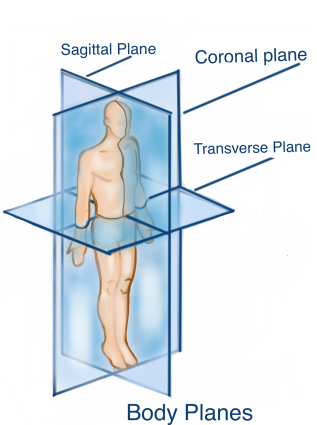
Image Orientation (#Movie 8.5) - Sagittal (longitudinal) = cephalad to caudad view.
- Transverse (axial) = cross-sectional or short-axis view similar to CT.
- Coronal = longitudinal view in a lateral plane.
Movie 8.5
Transverse to Longitudinal Planes
8.6 - Artifacts
Image artifacts include:
- Acoustic shadowing
- Gain artifact
- Posterior acoustic enhancement
- Reverberation
- Ring down (or comet tail) artifact
- Mirror artifact
- Lateral cystic shadowing (edge artifact)
Gallery 8.3
Artifacts
[[Pasted image 20251219134038.png]] | Acoustic shadowing (arrowheads) from gallstones
[[Pasted image 20251219134115.png]] | Gain artifact
[[Pasted image 20251219134134.png]] | Posterior acoustic enhancement (arrowheads) noted during ocular ultrasound
[[Pasted image 20251219134213.png]] | Reverberation artifact noted during soft tissue ultrasound (arrowheads)
[[Pasted image 20251219134249.png]] | Ring-down artifact (arrowheads) from an 18-gauge angiocatheter
[[Pasted image 20251219134329.png]] | Comet tail artifact (arrowheads) in a patient with pulmonary edema
[[Pasted image 20251219134409.png]] | Mirror artifact noted from transvaginal study of the uterus
[[Pasted image 20251219134439.png]] | Mirror artifact in the right upper quadrant (diaphragm: arrow; kidney: arrowheads)
[[Pasted image 20251219134528.png]] | Edge artifact (arrowheads) from the gallbladder
Acoustic Shadowing
- Caused by failure of the ultrasound beam to pass through an object, resulting in a dark area distal to the reflective or attenuating surface (#Movie 8.6).
Movie 8.6
Acoustic Shadowing
Acoustic shadowing from a large gallstone.
Gain Artifact
- Excessive amplification of the returning echo, such that it may obscure anechoic structures. Again, blood/fluid should be black. Underlying vascular structures may not be identified if the gain is too high (#Movie 8.7).
Movie 8.7
Gain Artifact
Femoral vessels obscured by gain artifact, with improved visualization as the gain is turned down.
Posterior Acoustic Enhancement (#Movie 8.8)
- Certain media allow efficient propagation of ultrasound waves (pleural effusions, abscesses, abdominal free fluid, large vessels or fluid-filled organs, etc.). With this increased “through transmission,” the tissue behind the media appears more echogenic as compared to the surrounding tissue. In other words, there is less attenuation of the ultrasound wave as it propagates through these types of media.
Movie 8.8
Acoustic Enhancement
Posterior acoustic enhancement from a cutaneous abscess.
Reverberation (#Movie 8.9)
- Occurs when there are two reflectors that line parallel to one another and perpendicular to the US wave. Sound gets trapped between these two highly echogenic surfaces, bouncing back and forth (think ping-pong) before finally returning back to the probe. As depth on the US screen is determined by the time elapsed from pulse initiation to reception, the returning echoes are displayed as recurrent bright lines similar to the rungs of a ladder (parallel and equidistant).
Movie 8.9
Reverberation
Reverberation artifact noted on gallbladder exam (extending into the lumen of the gallbladder).
Ring Down or Comet Tail Artifacts
- Two different forms of reverberation artifact. Both occur in the setting of two or more strong reflectors that are both very close together, and exist in a medium with high propagation speeds.
- Ring down artifacts occur with small structures (gas bubble or, classically, a hollow-bore needle tip) that produce a long, linear echo from the structure (#Movie 8.10).
- The reverberations of comet tail artifacts are so closely spaced that they actually merge. These may be seen with small, strong reflectors such as air, plastic, metal, and calcifications (#Movie 8.11).
Movie 8.10
Ring Down
Ring down artifact from an 18 gauge angiocatheter.
Movie 8.11
Comet Tail
Comet tail artifact on thoracic ultrasound of a patient with pulmonary edema.
Mirror Artifact
- Objects appear on both sides of a strong reflector (such as the diaphragm). Occurs when an ultrasound wave strikes the strong reflector, and a portion of the wave does not travel directly back to the transducer. Instead, it may bounce between the two reflective surfaces, resulting in more time elapsed. Thus, the mirror image (or false image) is displayed on the opposite side of the reflector.
Lateral Cystic Shadowing (Edge Artifact)
- Sound waves encountering a rounded or curved structure, particularly with differing propagation speeds, result in refraction of the wave that does not return to the probe. Since the wave does not return to the probe, shadow is seen along the edge.
8.7 References
Edelman SK. Understanding Ultrasound Physics. 4th ed. E.S.P. Ultrasound; 2012. ↩︎